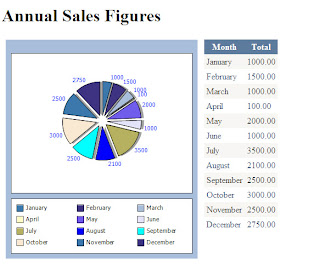
Here's an example of a pie chart with source code:
- Create a New Website Project in Visual Web Developer Express
- Create a Bin folder and add a reference to WebChart.dll
- Create a Database Table in your Database , I used Microsoft SQL Server Management Studio Express, called Sales with the columns id, Month and Total. Then add some dummy data to your table.
- In Visual Web Developer Express create a DataSet using the DataSet Designer to retreive your data.
- In Visual Web Developer Express create a class called Sales containing one method to return a DataTable containing your test data.
- Create an aspx file , I called mine SalesChart.aspx
- In your aspx file register the WebChart control like this :
<%@ register tagprefix="web" namespace="WebChart" assembly="WebChart"%> - Add a GridView control, I called mine gvSales.
- Add a WebChart control like this:
- In the code behind file Import the correct namespaces and add code to bind the data to the controls.
- Run your project.
SalesChart.aspx
<%@ Page Language="VB" AutoEventWireup="false" CodeFile="SalesChart.aspx.vb" Inherits="SalesChart" %>
<%@ register tagprefix="web" namespace="WebChart" assembly="WebChart"%>
<!DOCTYPE html PUBLIC "-//W3C//DTD XHTML 1.0 Transitional//EN" "http://www.w3.org/TR/xhtml1/DTD/xhtml1-transitional.dtd">
<html xmlns="http://www.w3.org/1999/xhtml" >
<head runat="server">
<title>Sales Chart</title>
</head>
<body>
<form id="form1" runat="server">
<div>
<h1>Annual Sales Figures</h1>
<table cellpadding="5">
<tr>
<td style="height: 402px" valign="top"><web:chartcontrol runat="server" id="ChartControl1" height="400" width="350" gridlines="none" legend-position="Bottom" /></td>
<td style="width: 204px; height: 402px" valign="top">
<asp:GridView ID="gvSales" runat="server" CellPadding="4" ForeColor="#333333" GridLines="None" AutoGenerateColumns="false" >
<FooterStyle BackColor="#5D7B9D" Font-Bold="True" ForeColor="White" />
<RowStyle BackColor="#F7F6F3" ForeColor="#333333" />
<EditRowStyle BackColor="#999999" />
<SelectedRowStyle BackColor="#E2DED6" Font-Bold="True" ForeColor="#333333" />
<PagerStyle BackColor="#284775" ForeColor="White" HorizontalAlign="Center" />
<HeaderStyle BackColor="#5D7B9D" Font-Bold="True" ForeColor="White" />
<AlternatingRowStyle BackColor="White" ForeColor="#284775" />
<Columns>
<asp:BoundField DataField="Month" HeaderText="Month" />
<asp:BoundField DataField="Total" HeaderText="Total" />
</Columns>
</asp:GridView></td>
</tr>
</table>
</div>
</form>
</body>
</html>
SalesChart.aspx.vb
Imports System.Data
Imports System.Data.SqlClient
Imports WebChart
Partial Class SalesChart
Inherits System.Web.UI.Page
Protected Sub Page_Load(ByVal sender As Object, ByVal e As System.EventArgs) Handles Me.Load
If Not Page.IsPostBack Then
CreateChart()
BindGrid()
End If
End Sub
Sub BindGrid()
Dim s As New Sales
Me.gvSales.DataSource = s.GetSalesFigures
Me.gvSales.DataBind()
End Sub
Sub CreateChart()
Dim chart As PieChart = New PieChart
Dim s As New Sales
chart.DataSource = s.GetSalesFigures
chart.DataXValueField = "Month"
chart.DataYValueField = "Total"
chart.DataLabels.Visible = True
chart.DataLabels.ForeColor = System.Drawing.Color.Blue
chart.Shadow.Visible = True
chart.DataBind()
chart.Explosion = 10
ChartControl1.Charts.Add(chart)
ChartControl1.RedrawChart()
End Sub
End ClassHere's the Sales class:
Imports Microsoft.VisualBasic
Imports System.Data
Public Class Sales
Public Function GetSalesFigures() As DataTable
Dim dt As New DataTable
Dim sta As New dsSalesTableAdapters.SalesTableAdapter
dt = sta.GetSales
Return dt
End Function
End Class
And last but not least, here's a screen-shot of what you should end up with:

No comments:
Post a Comment